In our last article we talked about how LIDAR is revolutionizing archaeology by spraying the landscape with lasers and creating high resolution maps that cut through tree canopies. Today we take that knowledge, find relevant data, and apply it directly to our hunting. This, is maps for lunatics.
I recognize this type of data centric hunting isn’t for everyone. There’s stats, downloading, analyzing, mapping — it’s just not everyone’s cup of tea. But if you soldiered through our last article and this type of raw data analysis is still intriguing — and you think it can apply to your hunting techniques, follow me!
Put the H-what H-where?
We probably need to go over a few terms. You already know that LIDAR stands for Light Detection and Ranging, but there are a couple more terms you should probably know. LIDAR images won’t always be available, but you can search for things like DEM or 3DEP with for your state. DEM stands for Digital Elevation Model and uses either LIDAR point clouds or topographic contour lines to create a three dimensional map of an area. Similarly, 3DEP is a program managed by the USGS that stands for 3D Elevation Program. 3DEP may be a good starting point for checking out data for your state.
Getting the Data
Great, but all of that crazy detailed data from the last article is in New Hampshire and already crowd-sourced and analyzed! That’s not teaching a man to fish, it’s giving someone a fish already cleaned with a recipe! Okay, well how about we check out my home state of Pennsylvania? By searching for “Pennsylvania State LIDAR Data” in Google we come up with a couple Promising results.
Penn State operates PASDA or Pennsylvania Spatial Data Access Library. On their page there’s an Imagery Navigator that allows you to sort through different imagery layers to see what’s available for your neck of the woods. We’re looking in the The Wilds region of Pennsylvania, also known as the Northern Camp Counties. When you find a region you’re interested in, say Warren or Elk county for instance you can right click inside the map to bring up a selection tool. The selection tool will allow you to see what imagery is available for that particular piece of ground.
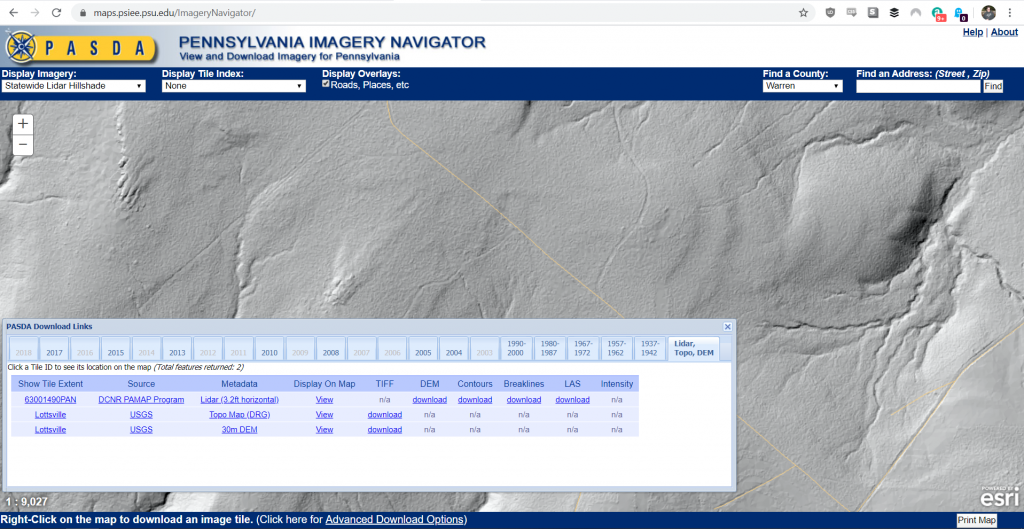
Saving you some stress these layers might even be able to be viewed directly on the imagery viewer. Right clicking on the map and bringing up the PASDA Download Links dialog will give you the option to see what years there are imagery, topo, dem, and LIDAR point cloud files available for download. Try to get the most recent files you can, though comparing through historic data can yield interesting results.
But I Don’t Hunt PA!
Well. You should. But since you don’t here’s some tips for looking for relevant data.
For federal data you can check the National Map for both LIDAR and High Resolution DEMs. If you’re willing to pay a little bit, there’s an Amazon Bucket with all of the National Map point cloud available for bulk research in a ‘Requester Pays’ type model. That’s really not my speed here. Further down the page it looks like Entwine.io has paid for the Amazon S3 bucket full of data and is querying on our behalf, so that might be an option. However the data ingested is limited to that available on the national level.
Tools of the Trade
Great, so now you’ve found some las (LIDAR) files of your area of interest that contain a LIDAR point cloud and perhaps you’ve also found breaklines and DEM files to augment that data. How the heck do you view them? Let’s go over a couple of different ways ranging from super easy low investment to progressively more complicated.
Plas.io
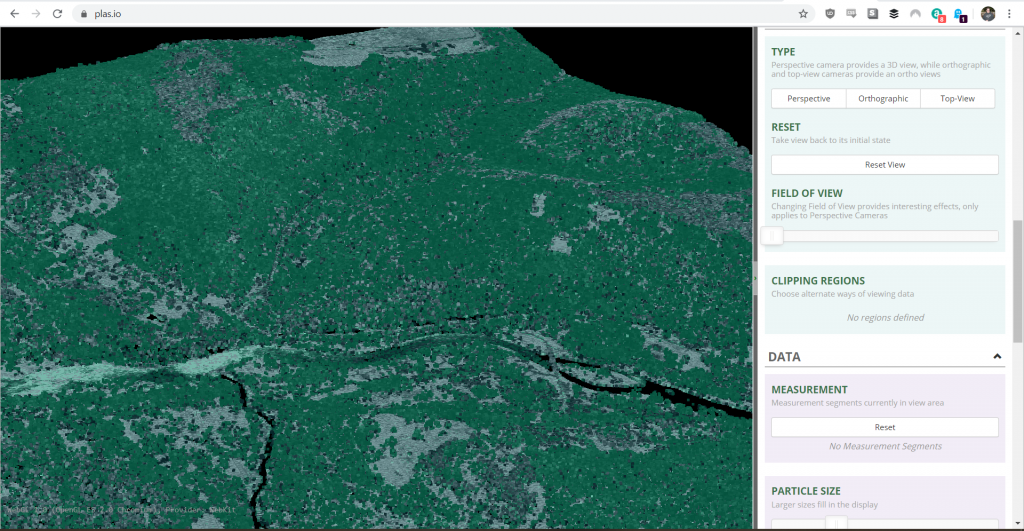
The plas.io website has a client side web application that allows you load las files right from your browser! It’s somewhat limited in features but gets you up and running right away. It’s not great for super large datasets as you can’t really translate or pan, but you can zoom using the “Field of View” slider.
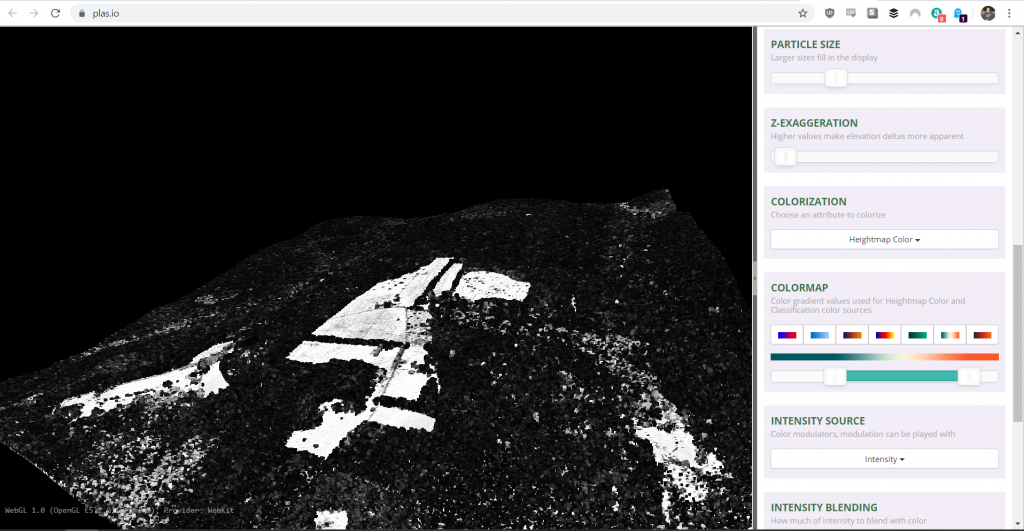
Data generally loads quickly, my 80MB file of Western PA LIDAR data shown above loaded in less than a minute in high resolution albeit black and white.
There are camera controls you’ll want to familiarize yourself with. For the purposes of analysis you’re likely to use Top-view and Perspective. The Field of View slider gives you a little bit of a zoom function. Under data it may be worth tinkering with the Particle Size slider in order to fill the gaps created. The LIDAR data is likely what’s referred to as a “point cloud” so it’s not a continuous pattern but a collection of measured points that paint a picture of what the plane saw as it flew over and shot lasers at the ground.
Notice that your map is still black and white, or at most grey? Go to Colorization and select “Classification” which will color the points based on how they’re classified in the point cloud. This means that the points classified as vegetation will generally be colored differently than the ones classified as the ground or a building. That’s if they’ve been classified at all. Select a color ramp from the Colormap selector and then go to intensity blending. Changing the slider from All intensity to all color colorizes the map, in our case based on classification.
Realistically that’s all there is to it. The tool is good for a quick once over and you don’t have to install anything. However it doesn’t lend itself to huge amounts of analysis or in depth analysis of point data to correlate to map locations.
lasview
These next two tools play off of each other. lasview and the QGis plugins work hand-in-hand, but you can use the lasview suite separately if you so desire. You can get the tools from the rapidlasso page, or a direct download link here.
Like plas.io above it offers a way to quickly visualize your data and sift through it. While the interface looks like something from a hacker movie in the 90’s the power is in it’s quickness to render and customization of the data visualization. When you download the bundle of tools you can unzip them and you’ll find a veritable plethora of different analysis tools. However, we’re after lasview (bin/lasview.exe). Navigate to it and fire it up and you’ll be greeted by a strikingly spartan user interface.
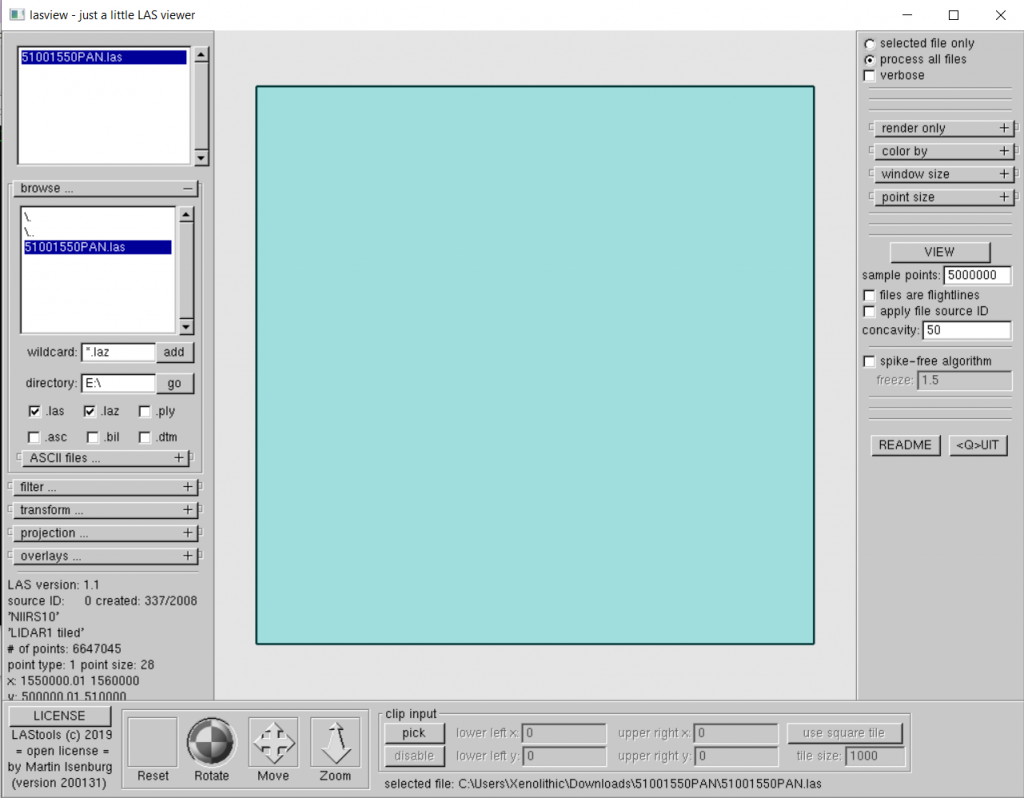
Clicking the + sign on the Browse button brings up the ability to navigate to where your las files are. From there you can load them. But wait… there’s just a blank plane on the screen! What gives?
From here we can click “View” on the right hand side of the screen which will allow lasview to run some background commands. You can tinker with the sample points field a little, otherwise the default 2 million points might be a little sparse depending on the point cloud you downloaded.
Of note you can change the pixel count size, I generally use 2 pixels if I need to fill out the empty space in the display, it helps some of the features really pop out without looking cartoonishly bloated. Otherwise keep it at one pixel. When you hit “View” you’ll be prompted with a command line in a somewhat clunky window. You can edit it here with custom arguments and then hit “Run” when you’re satisfied. The viewer will launch and display the point cloud in magnificent color.
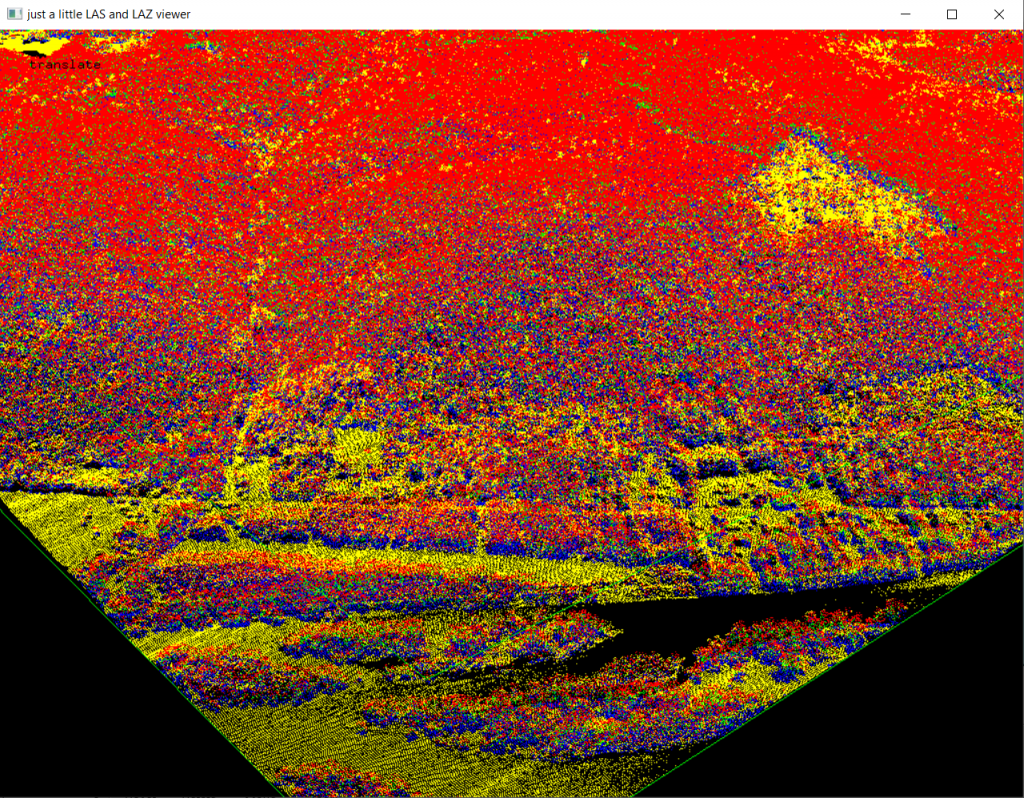
The controls can take some getting used to, but everything is quite fast to render on a modern PC. Right click anywhere on the screen and it’ll pop up a fairly detailed menu with visualization, editing, and camera movement options. Each option also has an assigned hot key which, once memorized, makes navigating much easier. Using the spacebar you shift between pan, zoom, translate, and tilt. Clicking and dragging the mouse allows you to actually change your view.
In the right click context menu “Color By…” and “Render Only…” are your friends. Tinker with the settings, I like Color by Intensity or Return. Using intensity data, if available in your dataset, is directly related to the reflectivity of the laser shot at the ground by the collection device. The laser is nearly always a near-infrared laser and it’s important to note that these measurements of intensity are relative by comparison to objects around it. That is to say that the laser might not have the exact intensity of reflection on the same material every time, but it does detect when it’s shot against different materials. Return means the height or timing of when the laser bounced back at the sensor.
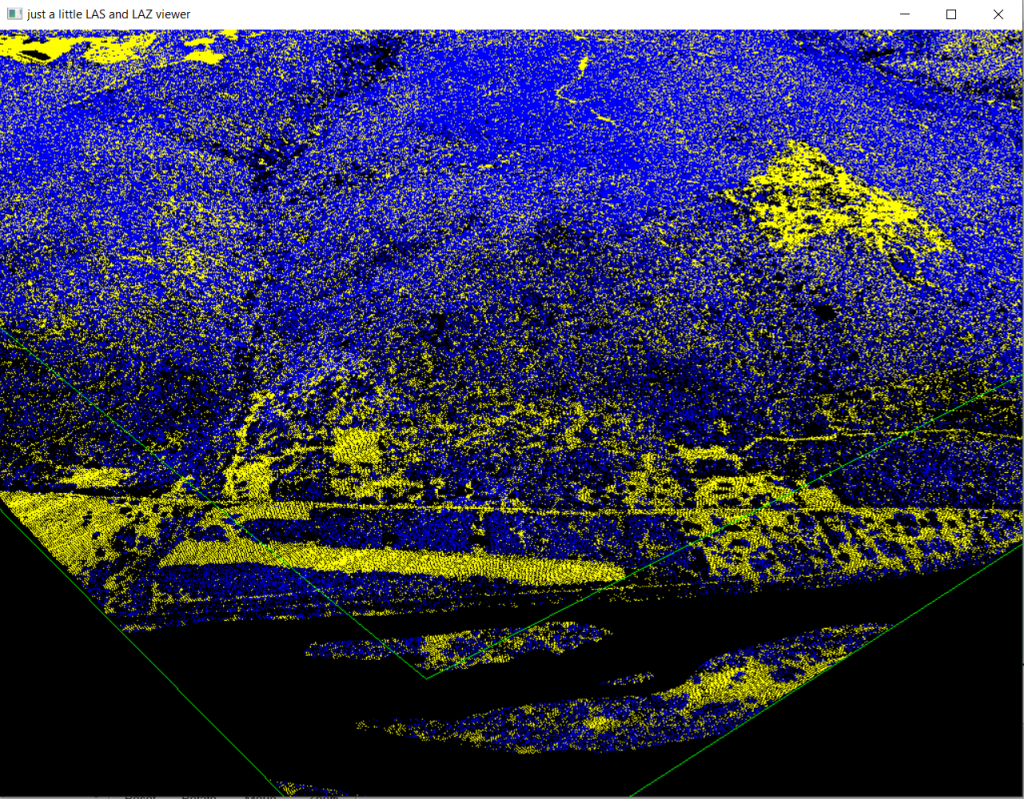
From here we can more clearly view the outline of some fields and roads using the LIDAR data. The straight lines in the case of the data shown above are roadbeds. Comparing imagery of the area from sources such as Bing or Google Maps will help you better contextualize what you’re looking at. The real power comes from things you can’t otherwise see from just imagery alone. LIDAR cutting through the canopy and then displayed by intensity will allow you to see where some bulldozer trails from a long past clearcut might go.
LASToolkit
QGis does indeed have a plugin to use the lasview and other tools provided that we already downloaded. This gives us the power of using these new tools in an interface we’re already familiar with. In order to make use of them you’ll need to install lastools from the plugins menu.
Note: There is a bit of an issue with lastools based on the license… when I went to do a little aggressive rendering of the LIDAR data I was met with the follwing warning:
LAStools console output Please note that LAStools is not "free" (see http://lastools.org/LICENSE.txt) contact 'martin.isenburg@rapidlasso.com' to clarify licensing terms if needed. WARNING: unlicensed. over 1.5 million points. adding a little noise to the lines.
So I reached out to Martin over at RapidLasso to see if I could clarify terms. Some of the state data comes with several million points in the point cloud, and I’d like to be able to have the fullest picture I can of my area of interest with the highest resolution possible. Some of the files I had downloaded for Pennsylvania had 6.3 million points registered. It would appear that the upper end of lasview and therefore the Lastoolkit is 5 million. He more or less said the research license is 2000 Euros, or not quite $2200, which is a little rich for my blood. If you can make your tiles smaller then you can get higher resolution.
The problem is less with the points and more with at the upper end of the points they make mention in the license that they purposely introduce noise. Which can be a problem for the detail work we would like to do.
Entwine.io
Want to make your poor little computer, really mad? When I was near distraught that I couldn’t view the raw LIDAR data with high resolution I went back to the drawing board and found an option too good not to share. It uses the same engine as plas.io and optionally a second style of viewer called potree but has a “point budget” of up to 10,000,000 displayed points. That’s double the lasview viewer!
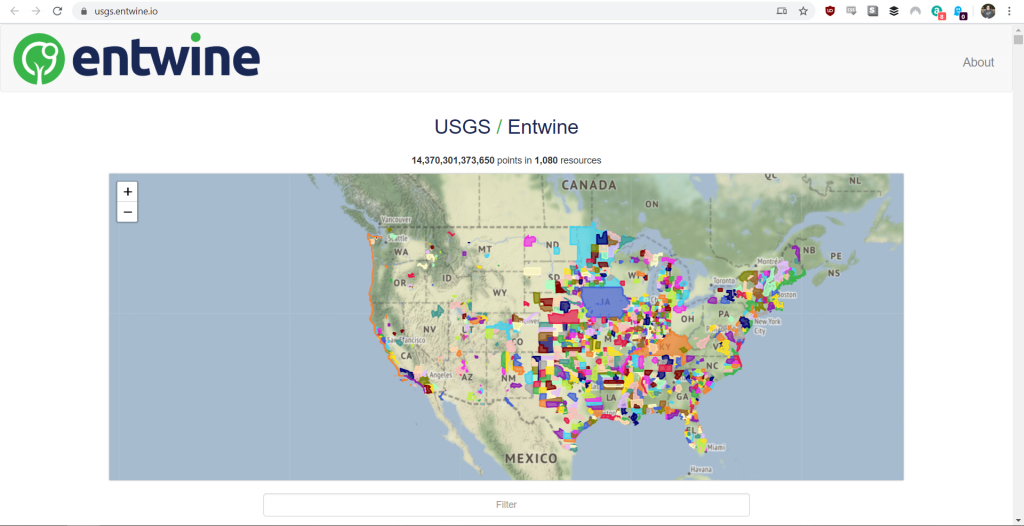
From the first blush it looks like it has decent coverage towards the middle of the state, so whitetail and grouse hunters take note. The indexed USGS Lidar data covers 14,370,301,373,650 points in 1,080 resources as noted on the website. That’s a lot of laser shots!
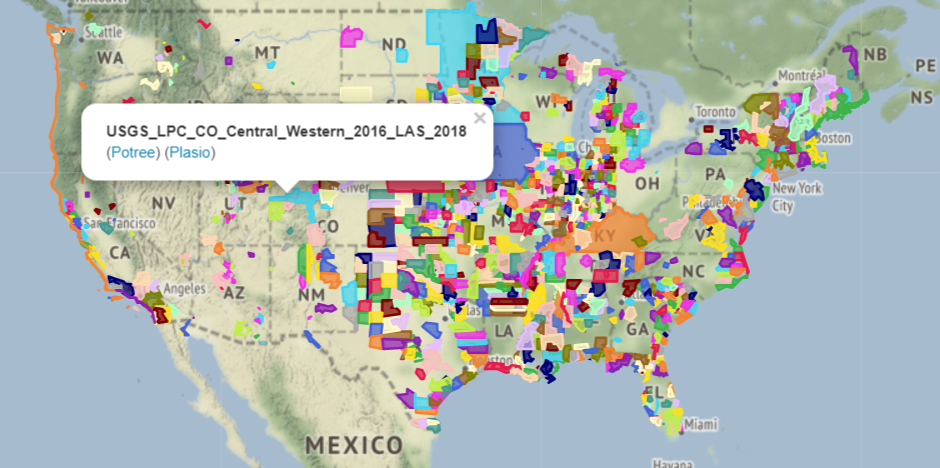
From here select a specific coverage area by zooming in and clicking a blob of interest. Then you’re told what the file is, and you have two options for opensource WebGL viewers. Potree.io and Plas.io both take LIDAR point clouds and render them in your browser. No extra downloaded software, no muss, no fuss. Well, a little fuss. Each interface is different and takes some getting used to. The Potree interface has the most options to tinker with in order to display your data but lacks the already indexed state data.
Once the potree viewer loads click the upper left hand corner of the screen where there’s a square with three lines in it. That will pop out the menu and the controls for the viewer. Use the field of view slider to zoom in, I believe the maximum zoom level is 20. Expanding the Tools menu gives you a lot of the same features you saw before in the plas.io viewer but also include some navigation buttons shown below.
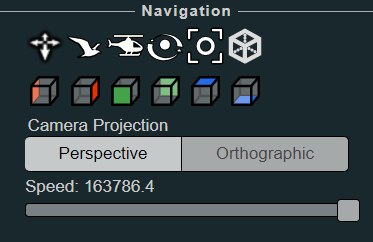
Using the Earth Navigation, the four arrows on the far left, allows us to click and pull the map the way you would on nearly every mapping solution. Select that and click around the map to move around. Under the Attribute subheading you’ll be able to select how you color objects in the point cloud similarly to the other viewers.
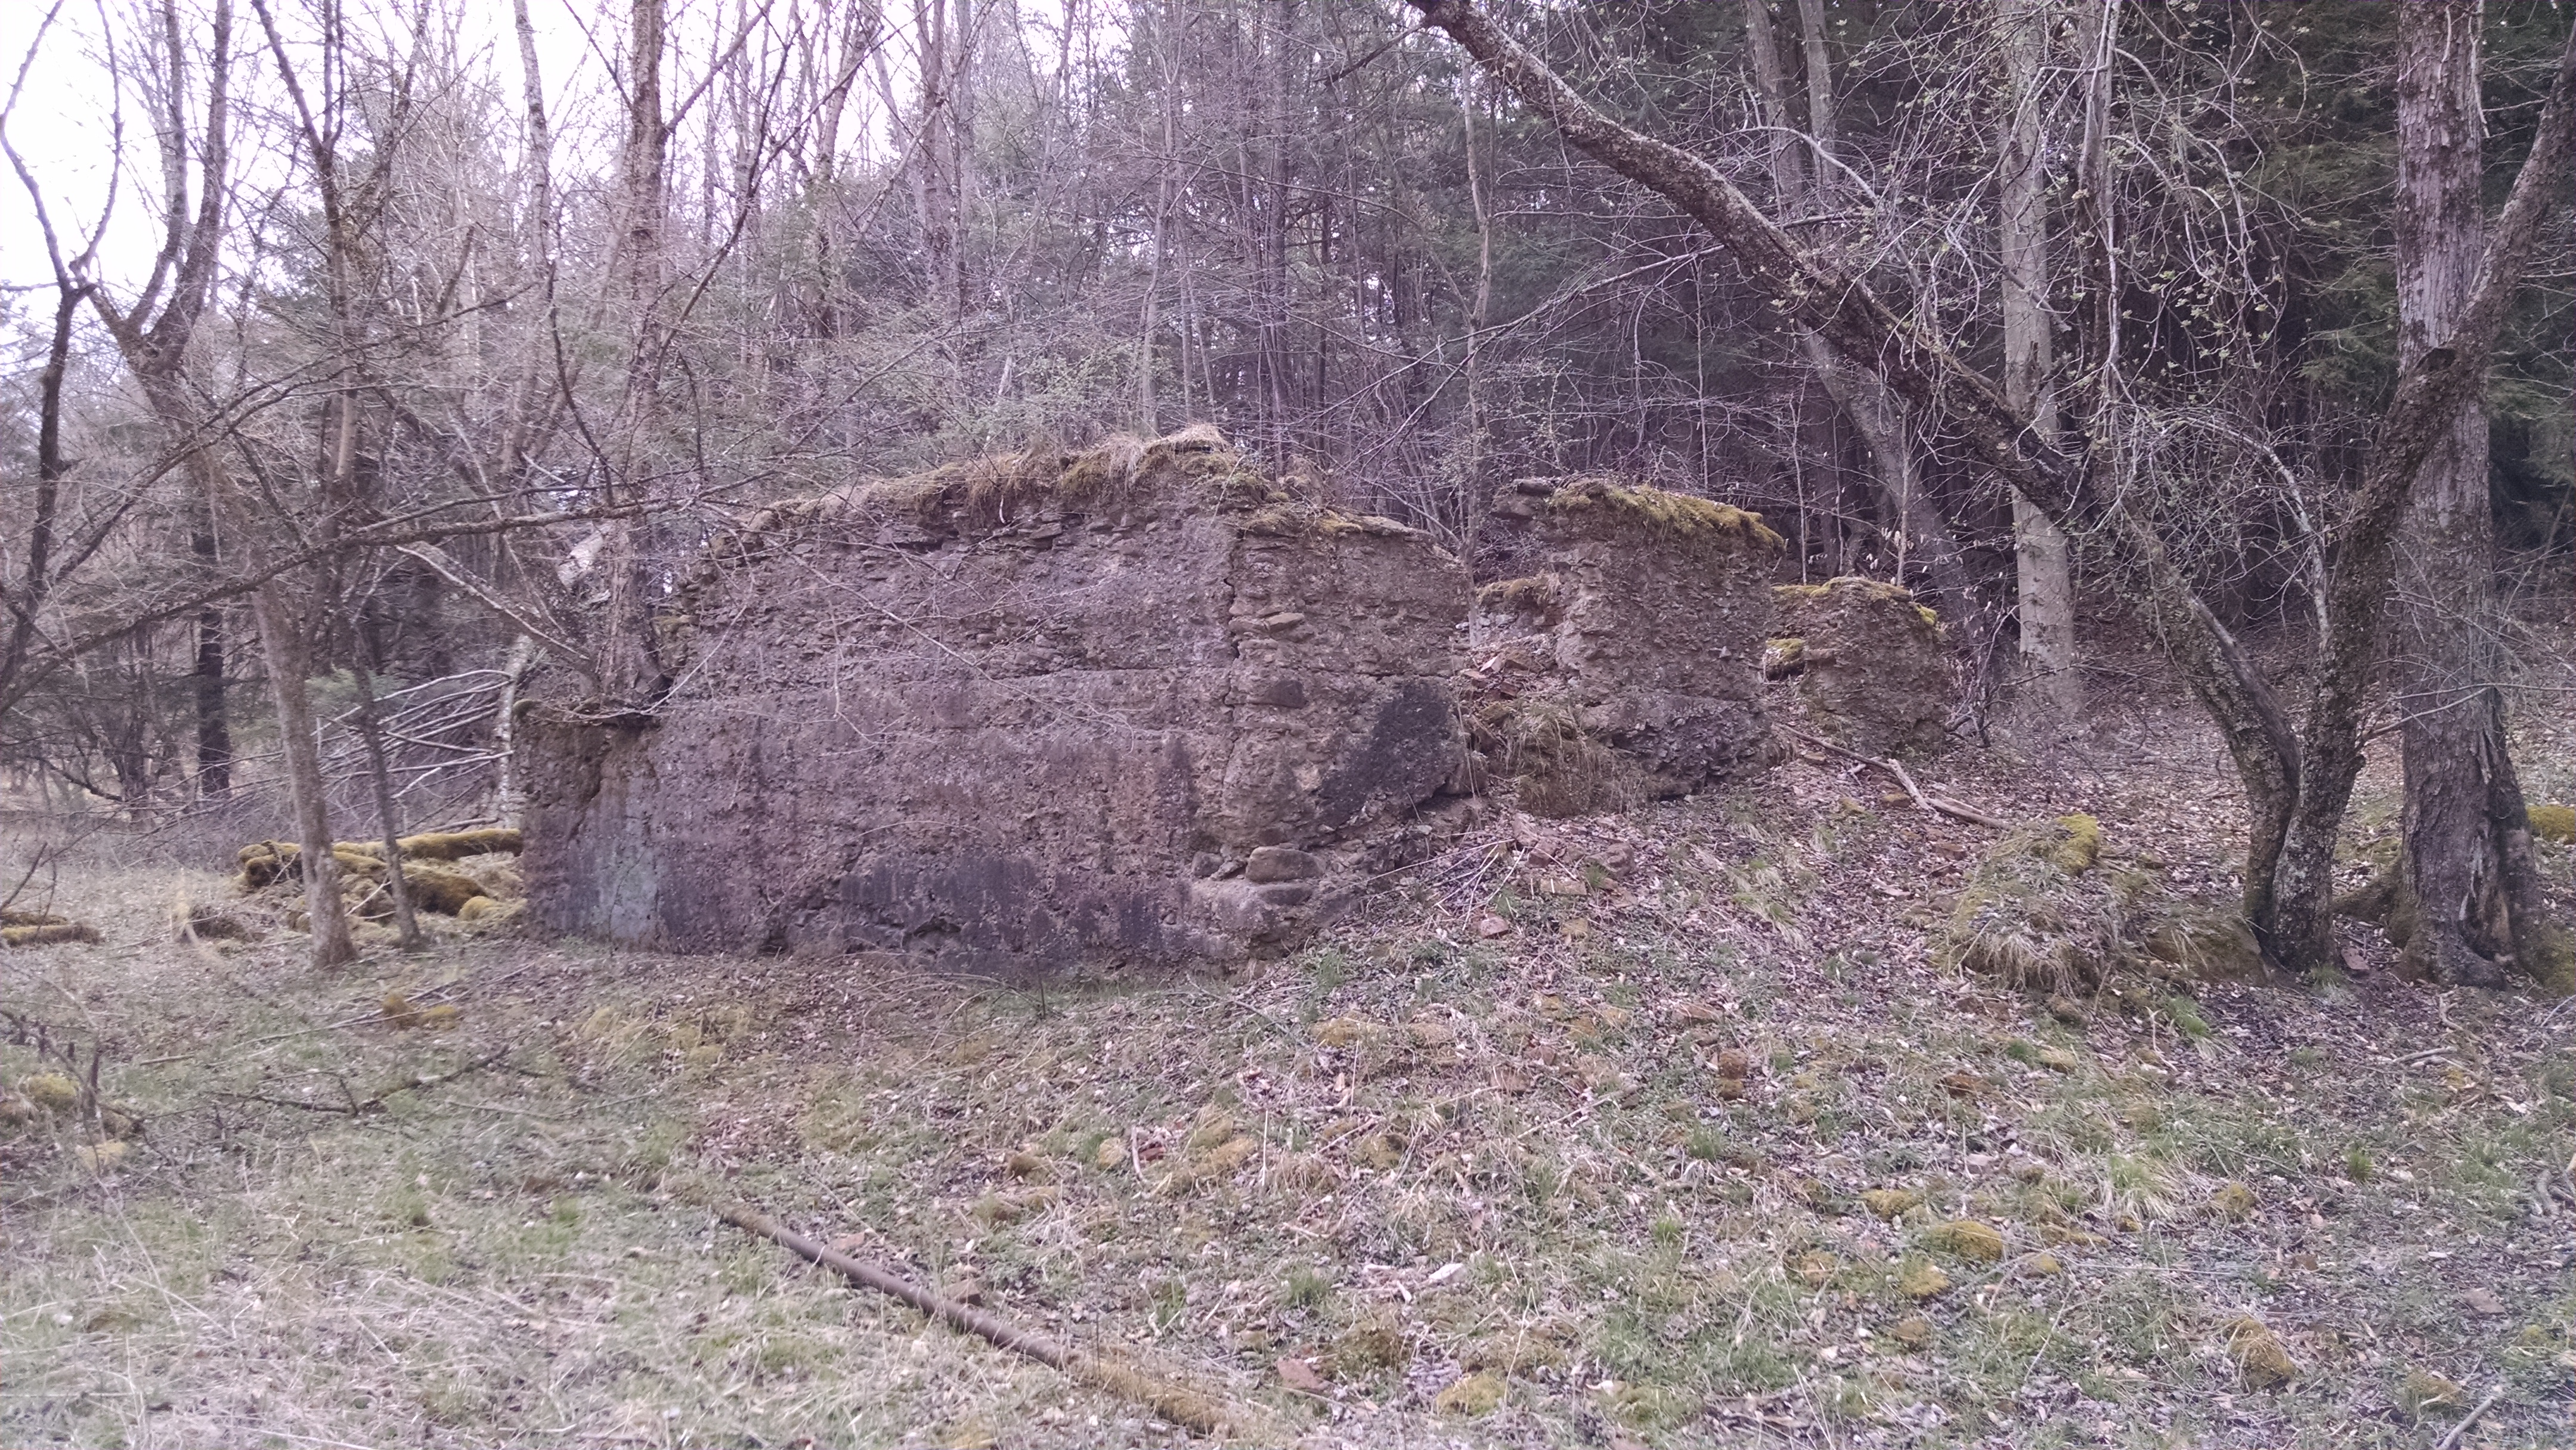
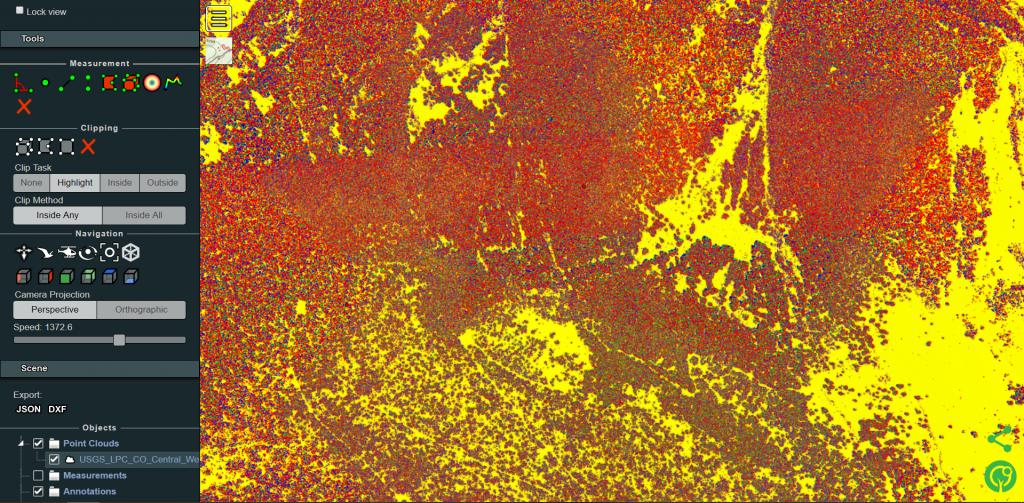
In the Filters subheading you can start removing layers if the data has been classified. Deleting High and Medium Vegetation layers strips the landscape of trees. However some assumptions are made here, if the data has not been classified then it is unlikely that if will work the magic way that it does for some researchers. I’ve found during my research that not all datasets are classified, but some tools will allow an auto-classification or filter for things higher than X height over the ground. That will allow you to see things like foundations, walls, road beds, and flat spots on hill sides.
Until Next Time
In our next article now that we’ve gone over tools and how to get the data we’ll go looking for some interesting formations. Knowing where the data is and how to view and manipulate it is more than half of the battle here. Maybe we’ll even find some grouse hideyholes!