APT Outdoors was started on a passion for mapping and technology, and hopefully I can use this platform to empower you to push some different forms of technology that have been traditionally been out of reach of the average hunter — or you’ve had to settle for far less than you deserve. Why, for instance do the maps in most hunting regulation books like they’ve been scribbled on a King’s place mat with some crayons? There are what appears to be a zillion Game Management Units in the state of Colorado, and it’s hard as hell to visualize the in-bounds hunting areas sometimes before figuring out where you want to go. As someone learning a new state this became extremely irritating. As much as I hated it, Maryland’s two Wildlife Management Unit’s (A and B) were much more easy to keep track of.
So I took matters into my own hands.
When I was in Maryland I wanted to narrow down my search into what State Wildlife Areas were available near my house. Google had failed me, the local Wildlife Agency had failed me because I was on the cusp of multiple regions, and the regulations books failed me. I thought about the problem a while, and realized I might be able to utilize some software I’d heard about through work. GIS or Geographic Information Systems sounds like a mouthful but think of it as a system of software to analyze data bound in geography. Some professionals use software like this to monitor water tables, or map population data, or road utilization. We’re looking for critters, and those grainy maps in the back of the yearly regulations books just don’t seem to do what you want.
Today we’re going to look at shapefiles and a FOSS (Free and Open Source Software) called QGIS. Shapefiles are exactly that, files that contain geometric shapes that the points that bind them are georeferenced, that is to say each point has a representative spot on the map. These shapefiles will be the outline of the state of Colorado, the Game Management Units, and the ptarmigan population density inside Colorado. That seems sufficiently esoteric, but data exists for the migration or population density for nearly every game critter if you know where to look. Colorado has some of these maps but they’re embedded in the website for the CPW or they’re so tiny inside the regulations booklet they’re barely any use at all.
First we install QGis to our Windows, Mac, or Linux (hey fellow geeks!) computer. Installation is straight-forward, just go with the defaults.
Then we start looking for our shapefiles, they’re often available from the USGS, the State or County, or any other number of repositories. The first time you do this takes some getting used to, but once you have a collection of useful data the results you can work up are really pretty interesting. I’ve done some of the legwork for you so you can follow along if you’d like, from the links above you can click the Download Link and throw the resulting files into a project folder. Name it Colorado Map or something like that.
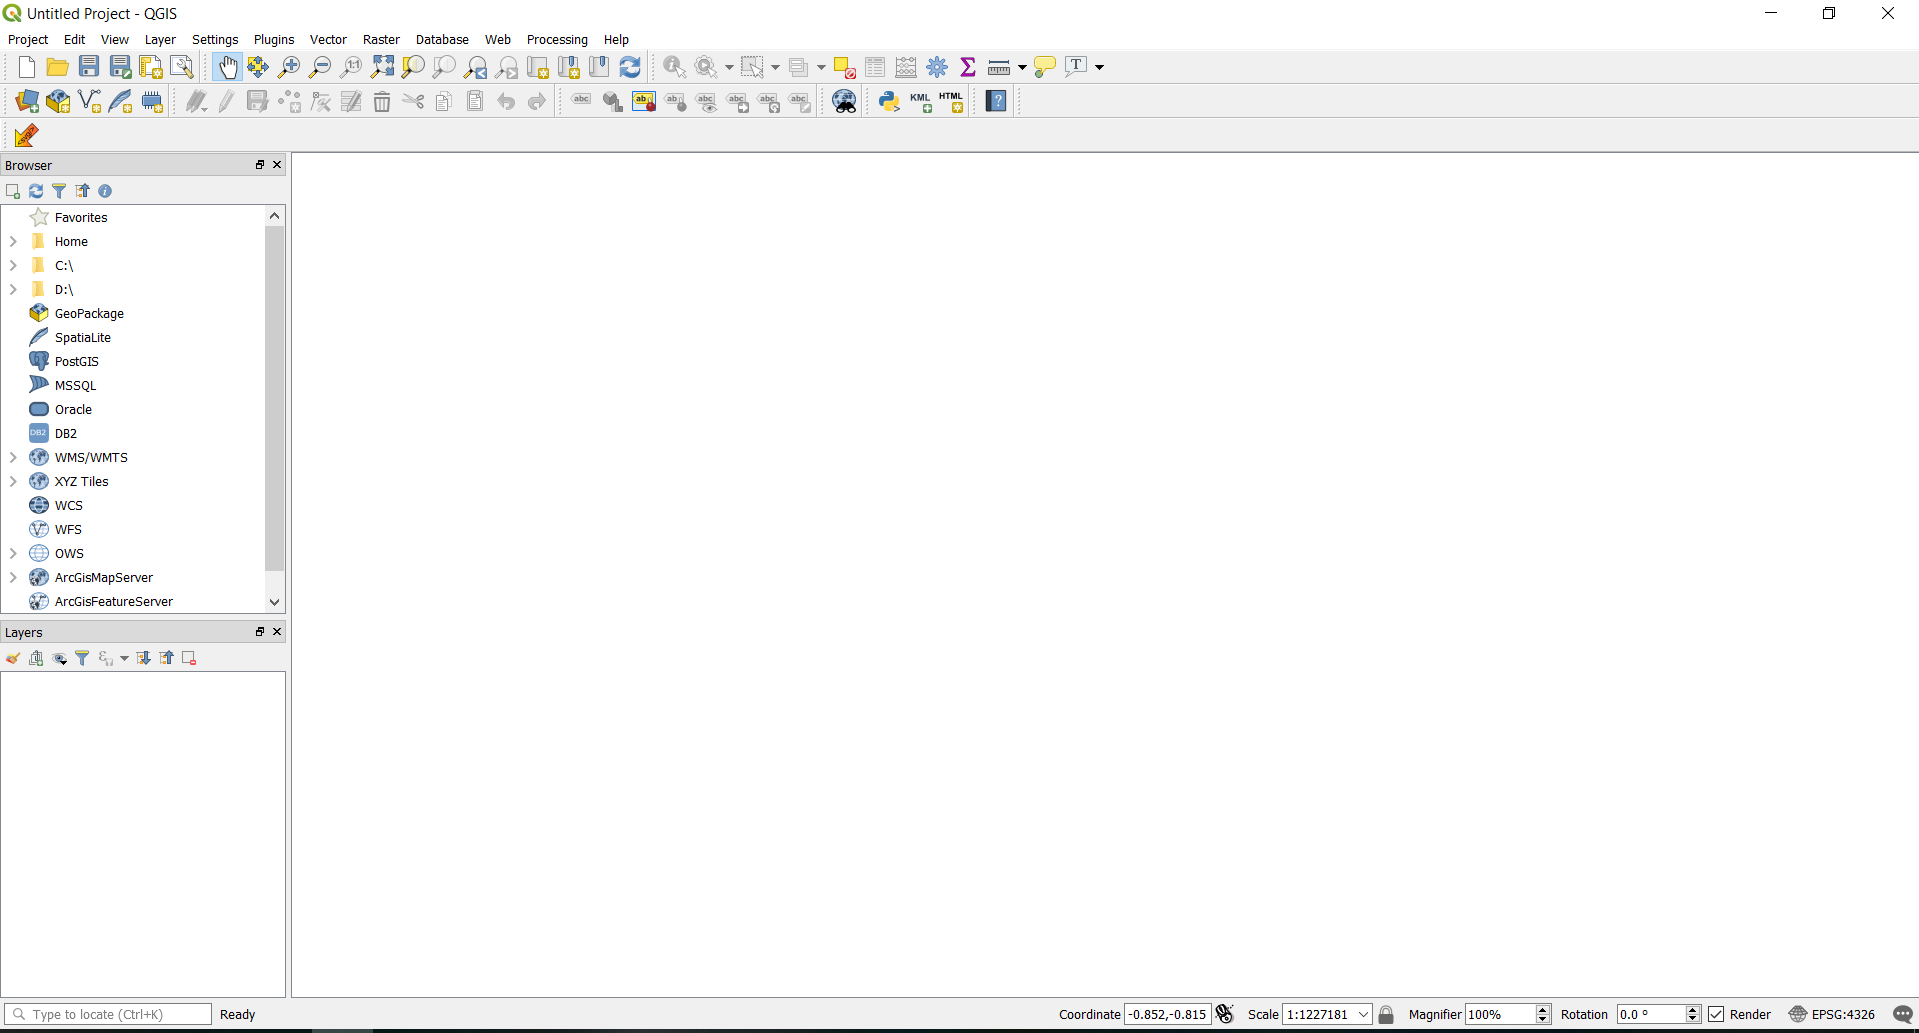
Now let’s fire up QGis for the first time. Each version is named after a major city, I’m using QGis 3.2 Bonn, today. Depending on how powerful your computer is it might take a minute or so to get everything loaded. Once the program is loaded let’s do Project -> New and now you’re staring at a blank canvas.
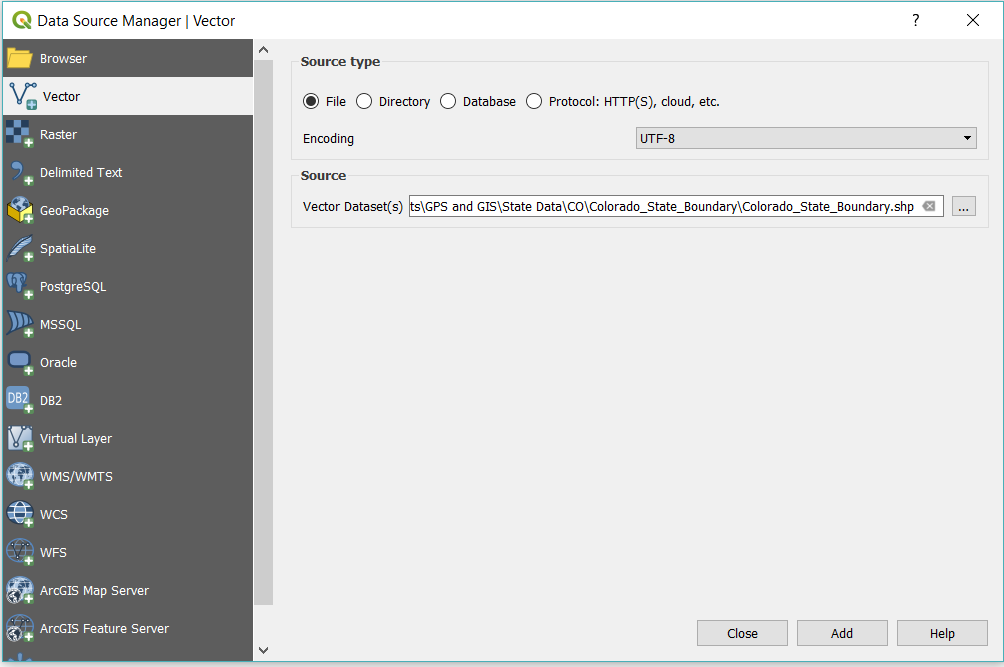
Now we’re going to add our first two layers, the Colorado State Outline and the GMU outlines. When you downloaded your shapefiles the Colorado State Outline was zipped, make sure you unzipped it, then go to Layer -> Add Layer -> Vector Layer and select the Colorado state outline. There will be several files in the directory, select the SHP file.
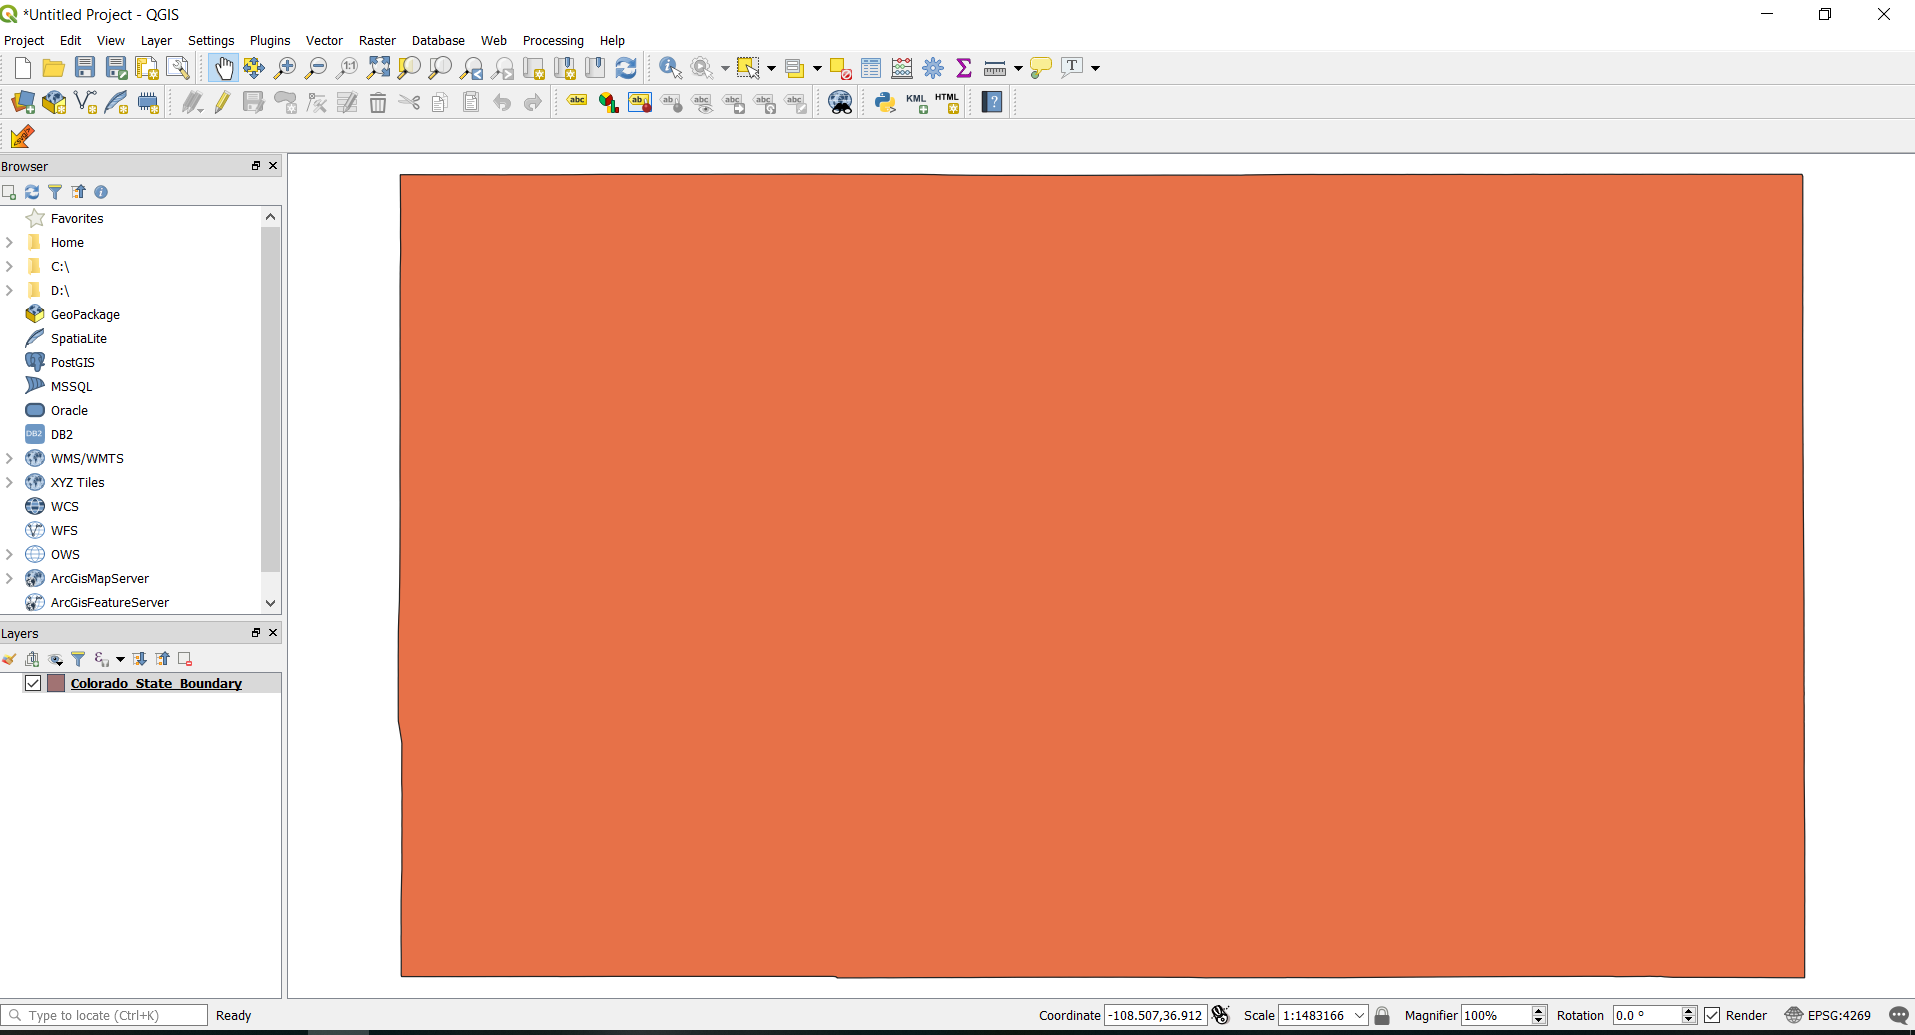
Now click Add and because we chose Colorado you see nothing particularly fancy, just a rectangle with a randomly assigned color. That’s our first step. You’ll also notice in the bottom left hand corner of the screen there’s now a layer added with the same color. We’ll work with those layers in a bit.
Let’s repeat the process and add a vector layer for the Game Management Units, shall we? Well, not quite yet. The Layer for the Game Management Units is an .lpk file, which is proprietary to ArcGIS, a commercial GIS software. Guess it’s time to give up, right? Nope. You can install 7zip, or any other archiving tool that handles 7z files and you can extract that file.
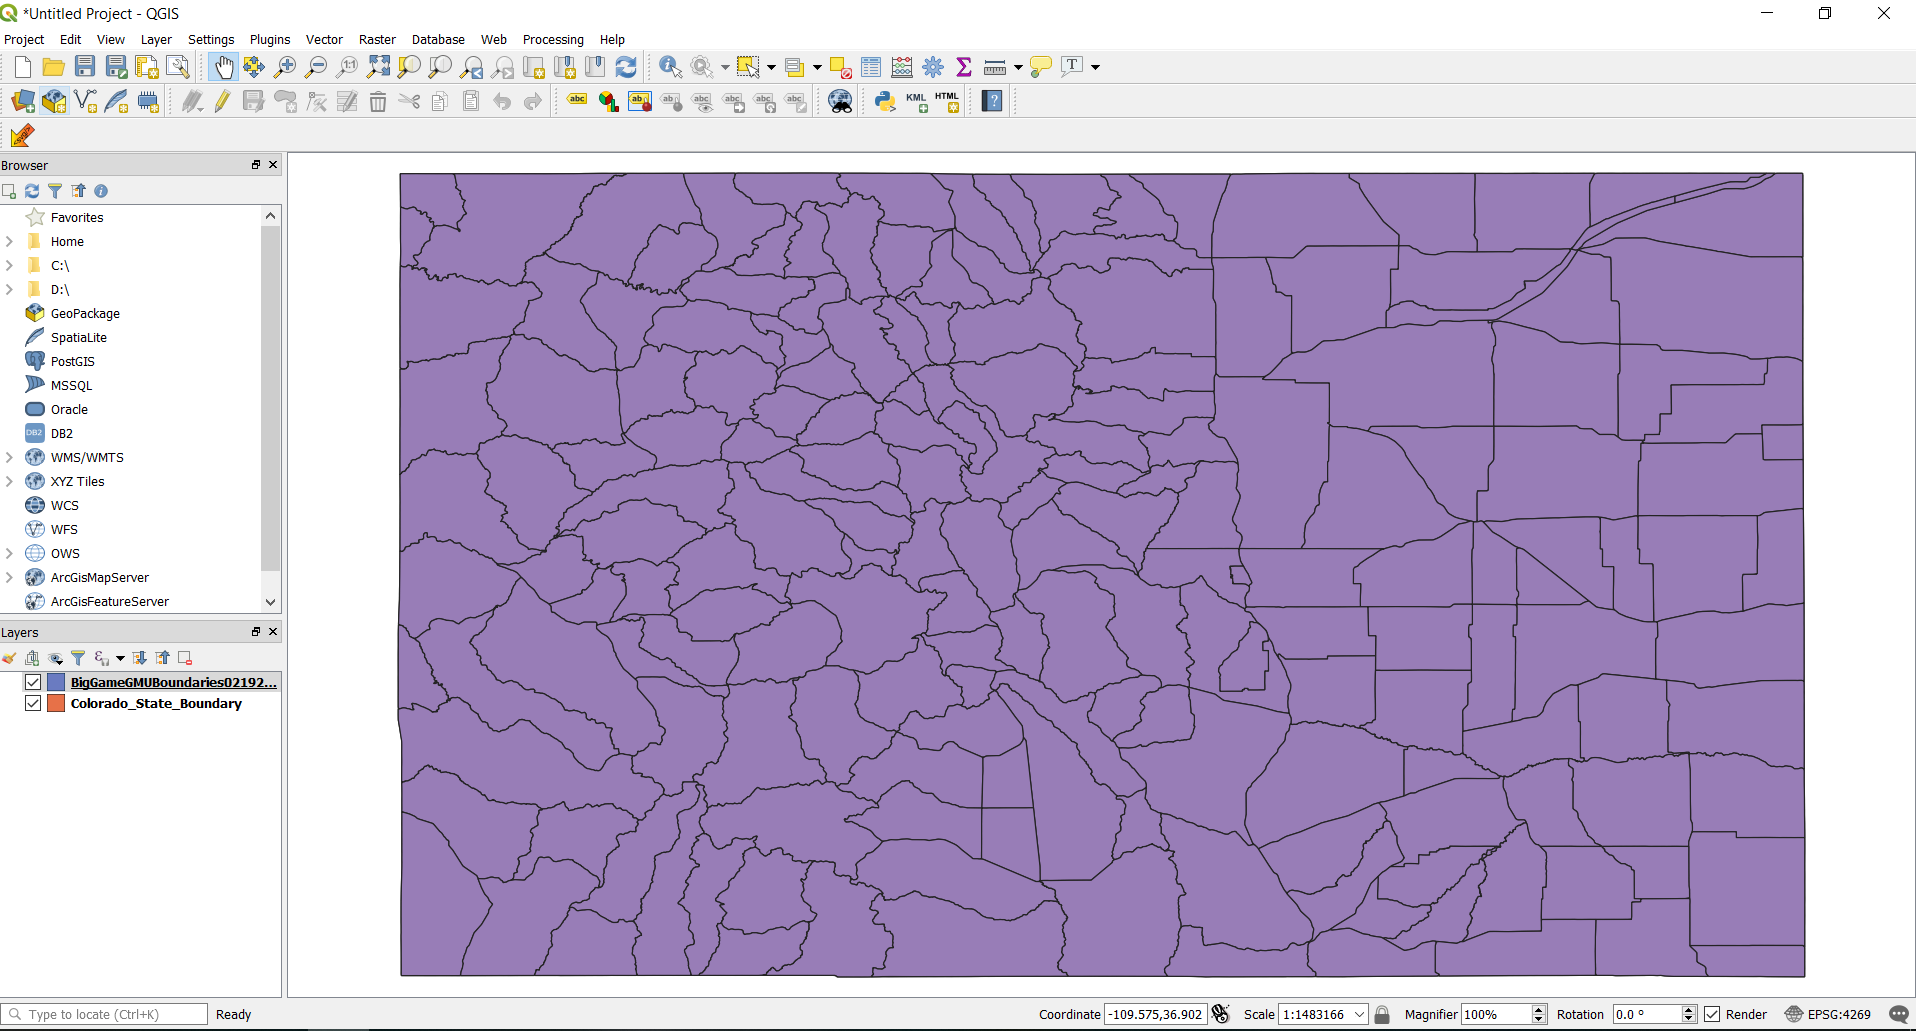
Simply right click and rename the file, change the .lpk extension to .zip and unzip it with 7zip! The shapefile itself once unzipped will reside deeper in the file structure, under CPWPublicAdminData\commondata\current. Go to Layer -> Add Layer -> Vector Layer and add the GMUs we downloaded earlier. The shapefile in question here is BigGameGMUBoundaries02192019.shp that we want to add. Play around, you’ll also notice that there are management units for Big Horn Sheep and other interesting files of interest. We’ve got two layers now, conveniently the GMU layer should now be on top, fully hiding the Colorado state outline.
Let’s begin to get into the nitty-gritty shall we? Let’s take a look at the 2018 small game regulations book and see what ptarmigan regulations said this past season since the PDF isn’t up on the website yet for the coming season.
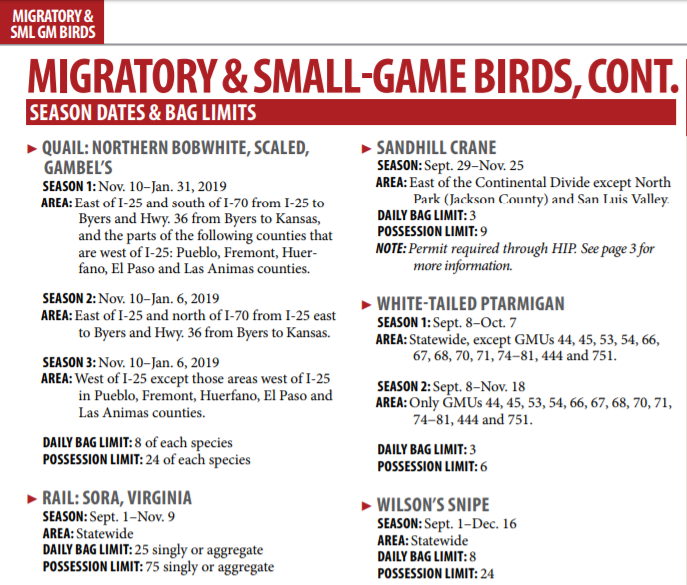
Just in case the above graphic is an eye chart, Season 1 is as follows:
SEASON 1: Sept. 8–Oct. 7 AREA: Statewide, except GMUs 44, 45, 53, 54, 66, 67, 68, 70, 71, 74−81, 444 and 751.
This is where things start getting interesting. On the bottom lefthand side of your screen, select the layer you just generated with the GMU borders, right click and select Filter. This brings up the Query Builder.
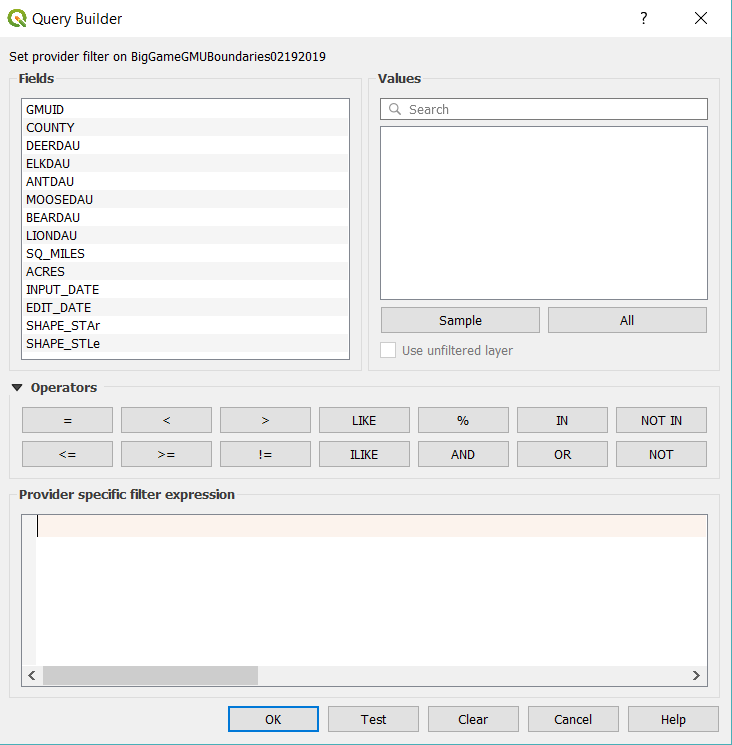
Select the GMUID from the left hand side and double click it, it’ll be added below. We’re going to cut to the chase, and based off of the above we’ll build our query to look like this:
“GMUID” NOT IN (’44’, ’45’, ’53’, ’54’, ’66’, ’67’, ’68’, ’70’, ’71’, ’74’,’75’,’76’,’77’,’78’,’79’,’80’,’81’,’444′,’751′)
Hit the Test button, and if everything looks good to go, hit OK.
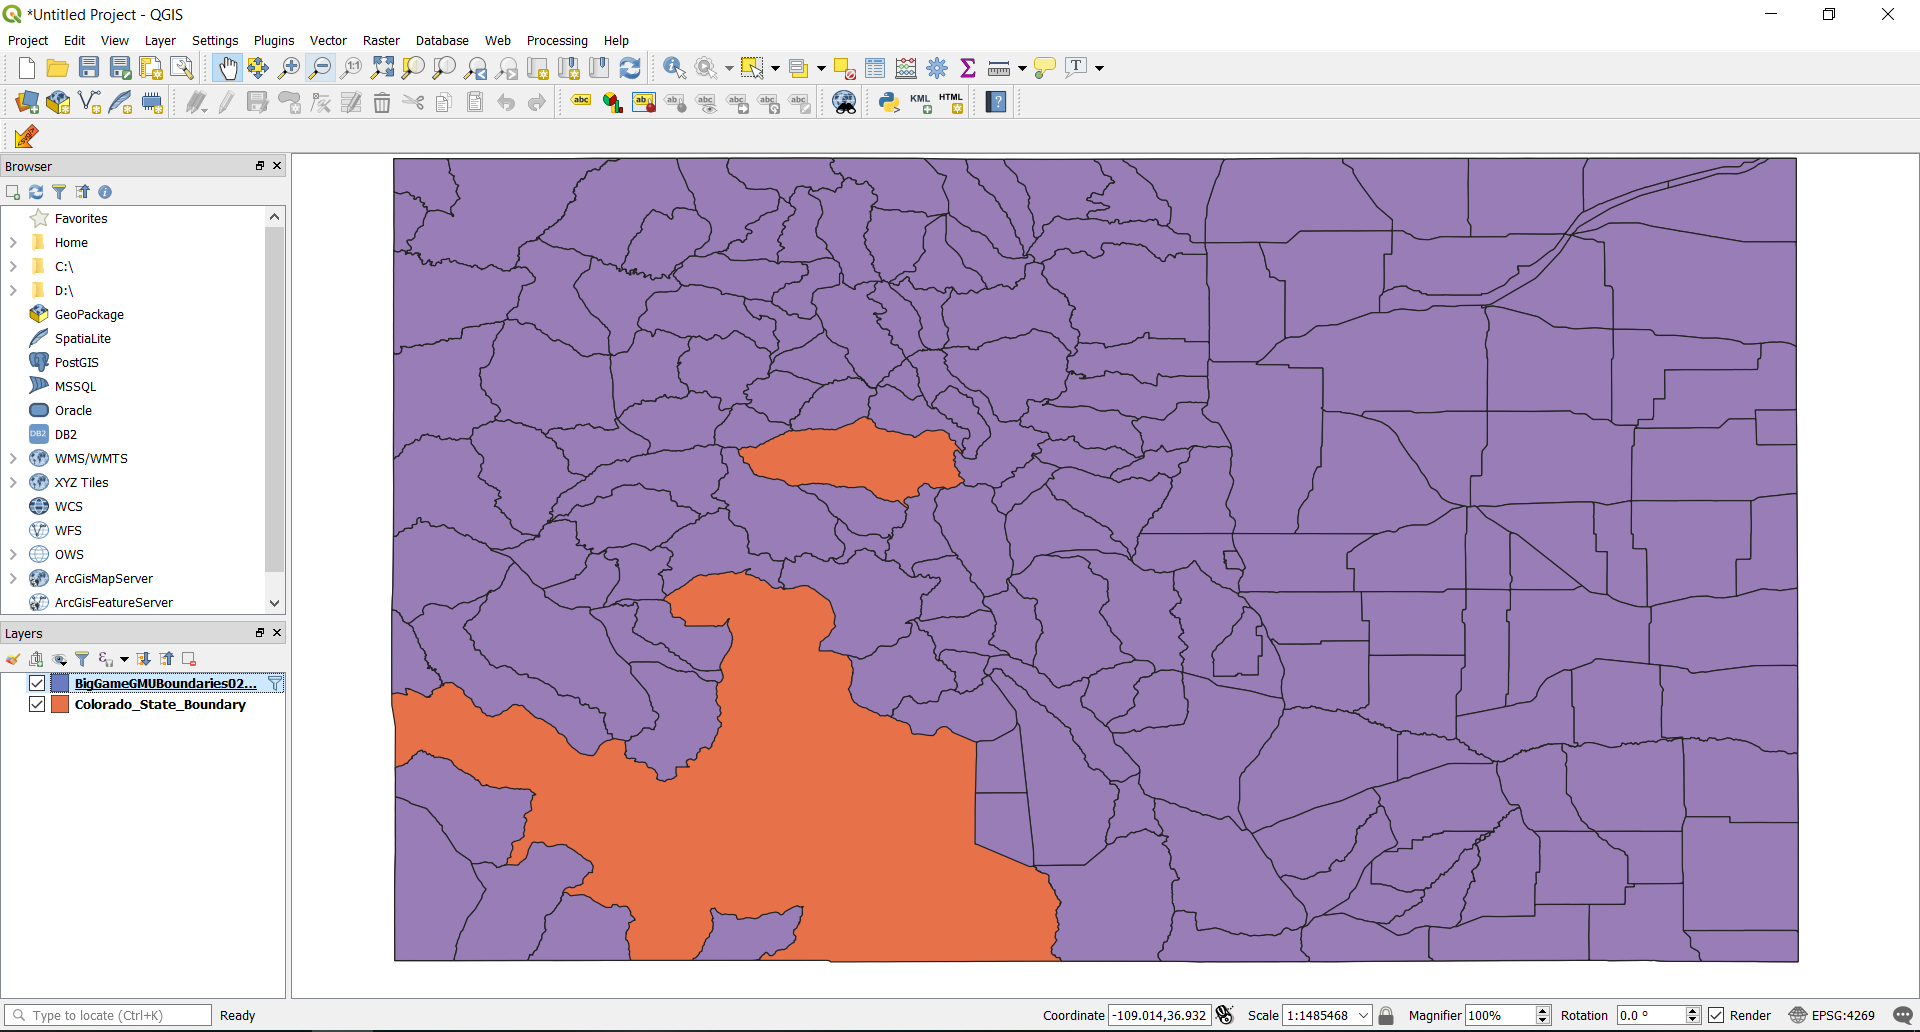
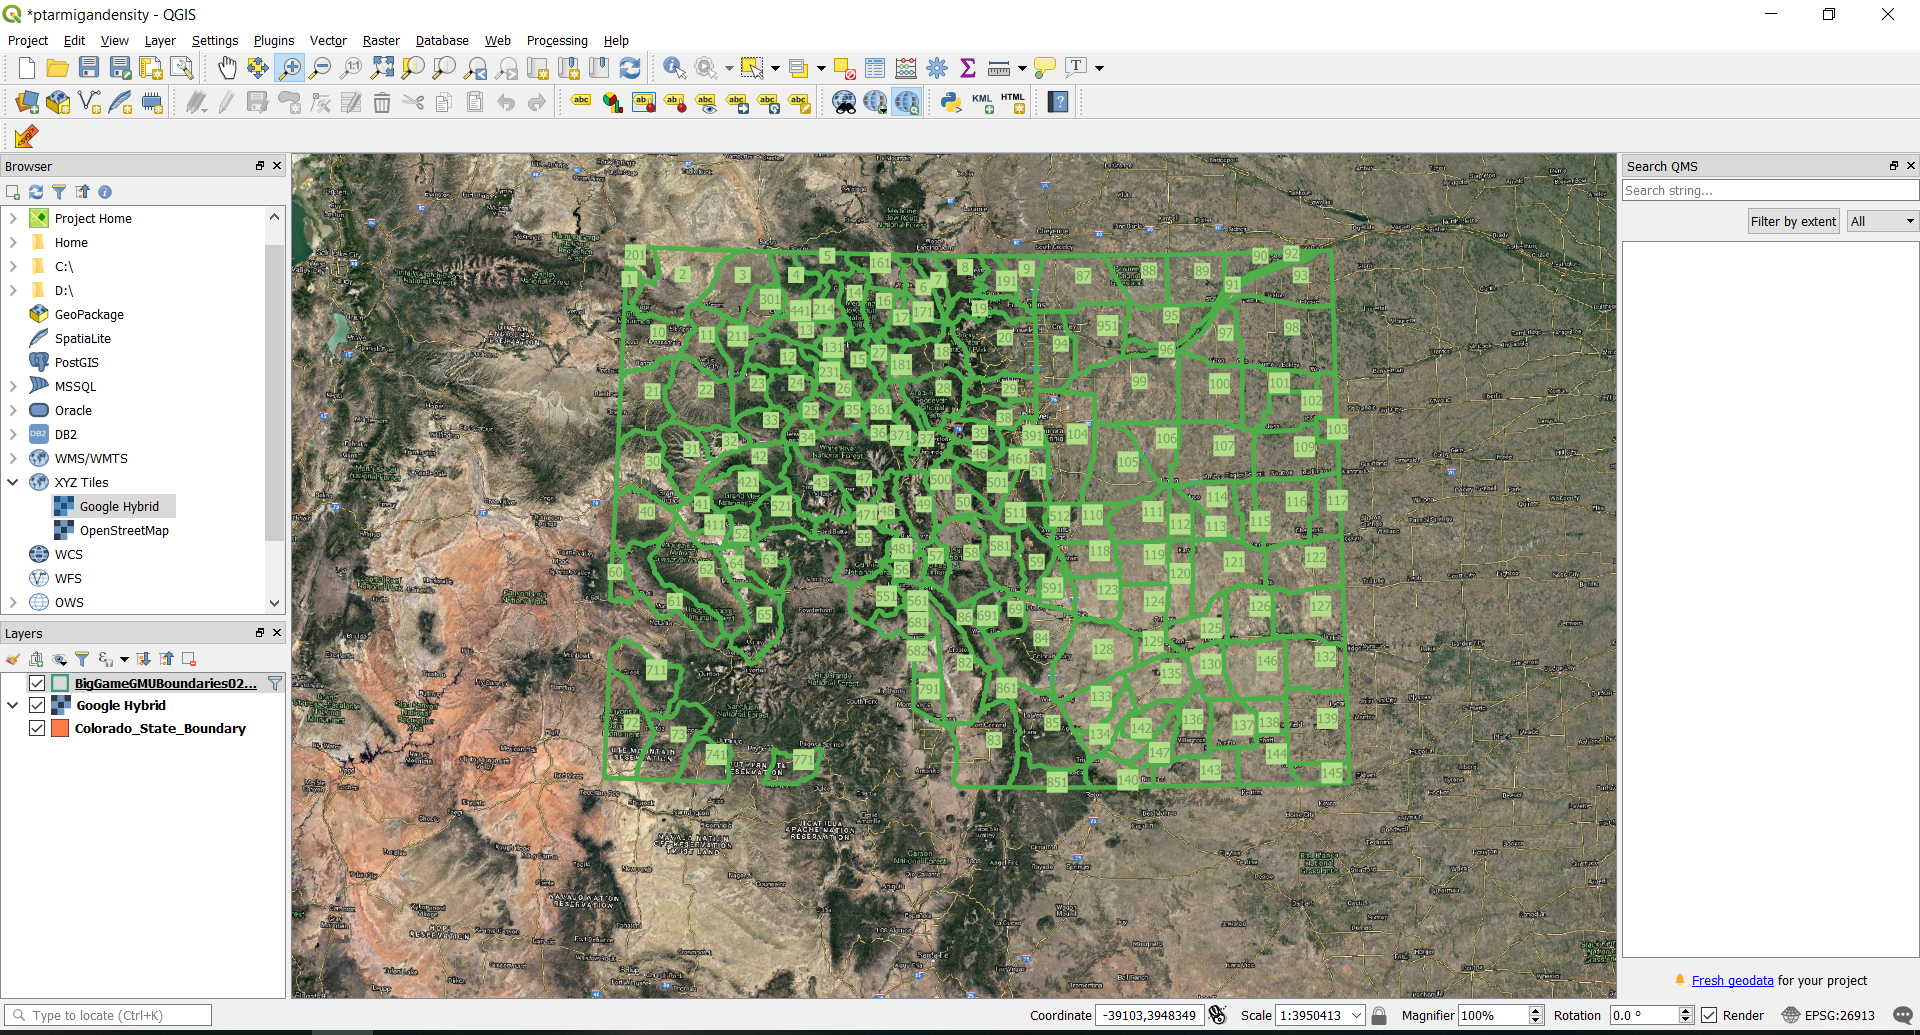
Now, this map is a mess. You’ve determined where you can and cannot hunt in the state, but the map is useless. Can you see where you live, where you want to go? None of this data really matters. Yet.
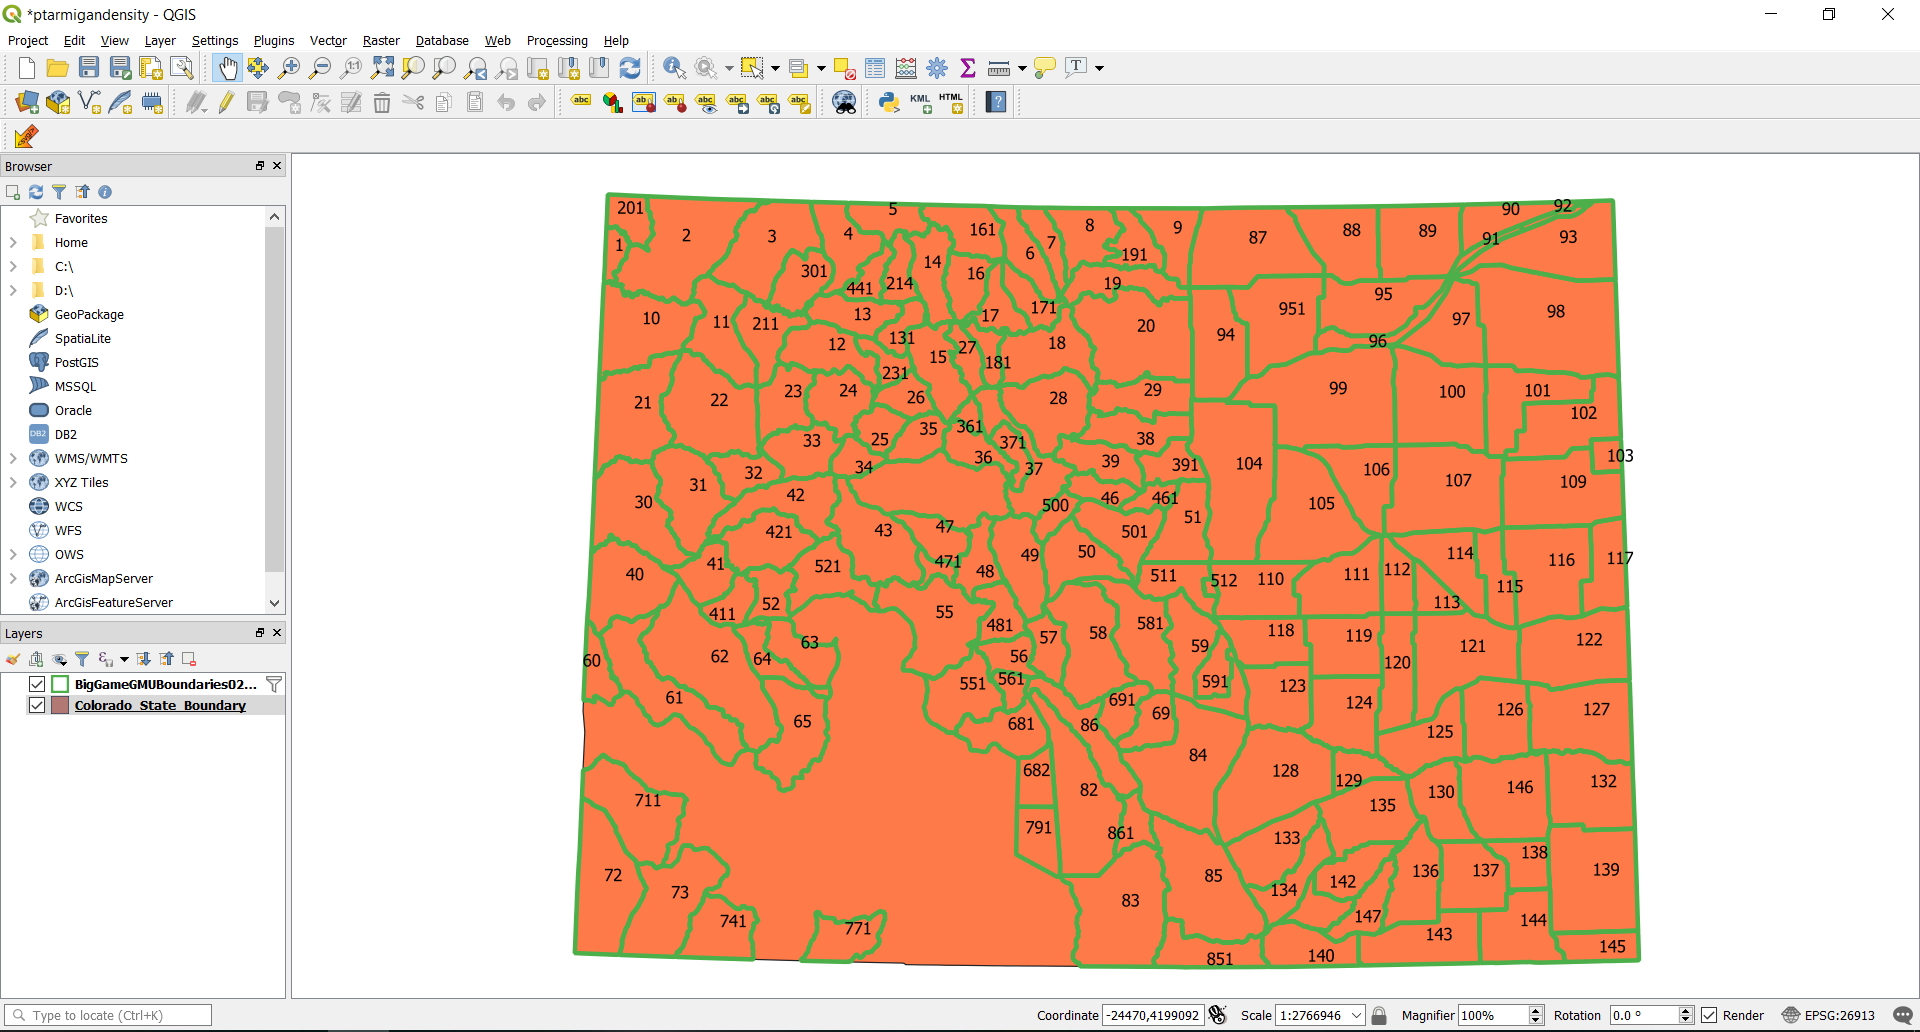
Choosing your GMU Layer let’s make it a little more easy to see when we are analyzing it later. Select the layer in the Layers panel in the lower left and right click Properties. In the window that appears select Symbology and select outline green in the bottom section marked as Symbols in Favorites.
Now navigate on the left hand side of the window to Labels. Here is where we’ll add the GMU titles, and while there are a ton of them, this will be handy later. Select the dropdown that currently says “No Labels” and select Single Labels, then in the Label with field select GMUID from the dropdown box. Change the Font size to 8.0 and the opacity to 30%, just slightly below the font size diaglog. To increase the visibility of the labels against the background we’re going to select the “Background” option, the one that looks like a little highway shield, and select square, scrolling down to fill color select a muted green color or something else visually appealing and will stand out on the map. Click OK. Now you’ve added a little context to your map, but there’s still no roads, towns, or bird information.
Let’s Add some roads for some context… Go to the Browser section of your QGis window, on the left just above your layer window and expand the XYZ Tiles selection. There might be one option, OpenStreetMaps. We’re going to add the Google Hybrid map tiles to our existing map. Something you’ve probably seen before. Right click XYZ Tiles and select New Connection. It’ll pop up a dialog box. Title the layer something that makes sense, I chose “Google Hybrid” and in the URL box we put:
https://mt1.google.com/vt/lyrs=y&x={x}&y={y}&z={z}
This is what’s called a TileServer URL, and most major mapping companies have them on the net — some are free some are not. Many of them are documented if you just dig. So if you prefer Bing Maps over Google, chances are the TileServers are documented. When creating a custom hunting map it’s good to check multiple map images because the satellite imagery is likely purchased at different times from potentially different sources. Click OK and the source has been added, but it’s not yet on your map. Now we right click the Google Hybrid option that is under the XYZ Tiles entry and select “Add layer to canvas“. The tile layer is added as the top-most layer, so let’s click the GMU Boundaries layer and move it to the top.
What were we doing? Oh, right, hunting ptarmigan. The CPW releases their critter migration data suitable for ArcGIS, so it’s another lpk file. Save that to the same location you have your other shapefiles and follow the instructions above for unzipping the lpk and identifying the layer in question so we can add the ptarmigan’s overall range to the map. The shapefile you’re looking for if you’re still with me at this point is PtarmiganOverallRange11082018.shp but you’ll notice there’s some other very enticing shapefiles in the collection, such as Elk, Mule Deer, Big Horn Sheep, and even Abert’s Squirrel for you Rocky Mountain Squirrel Foundation guys.
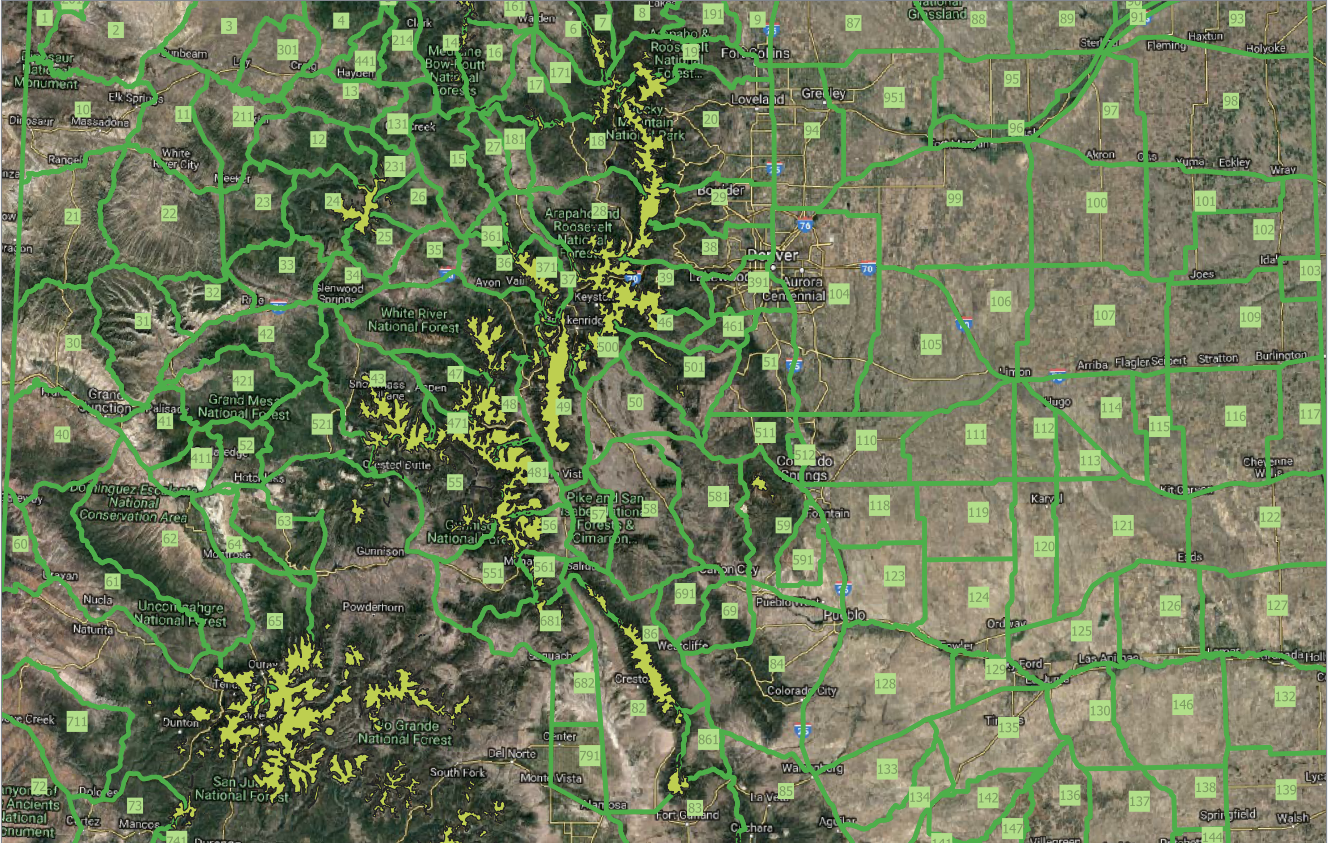
So clearly we can disregard the eastern half of the state and focus central-west in the mountains for our search. No surprise there given that ptarmigan are high altitude cold weather birds, but the regulations are written in such a way that if you found a lost ptarmigan somewhere near the Nebraska border you might as well be able to put it out of it’s misery.
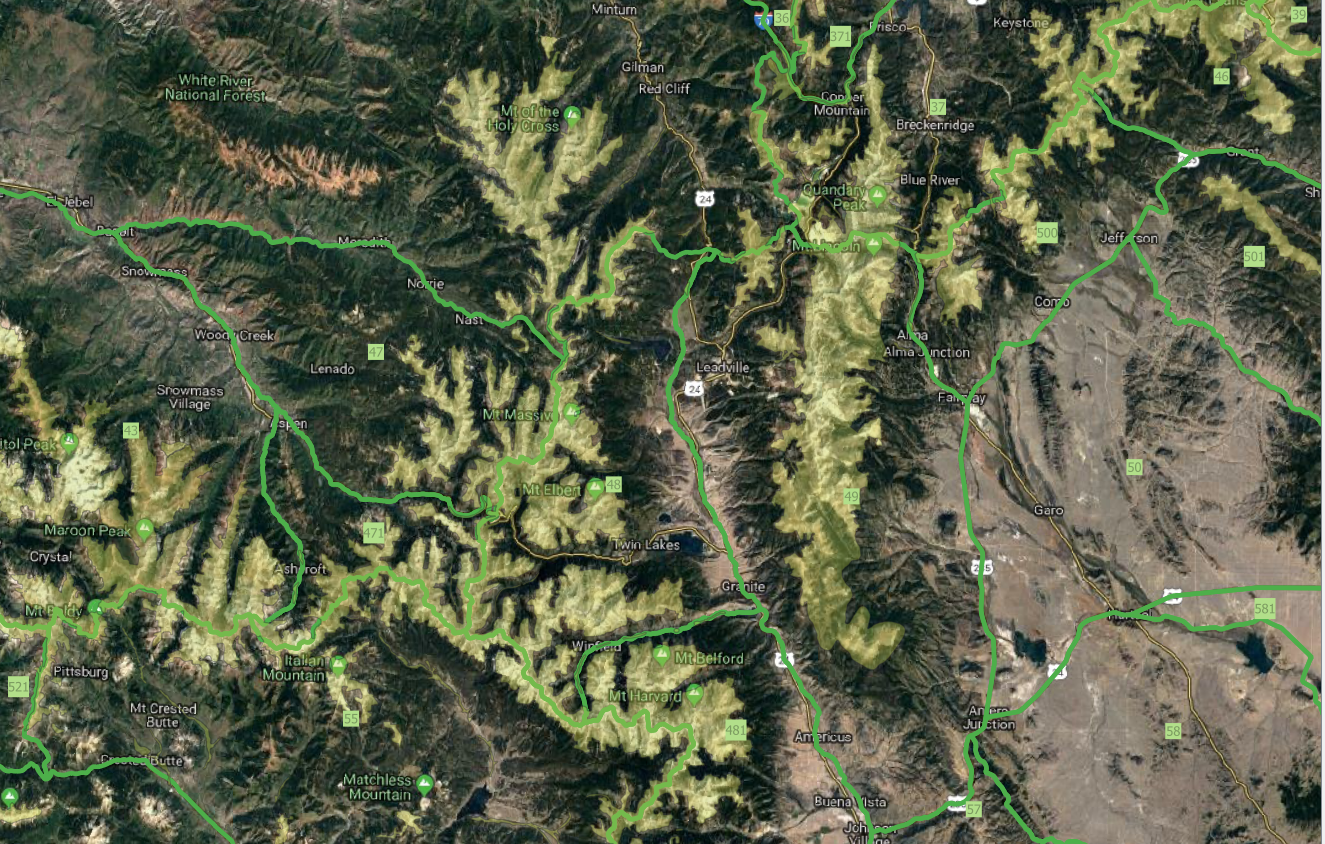
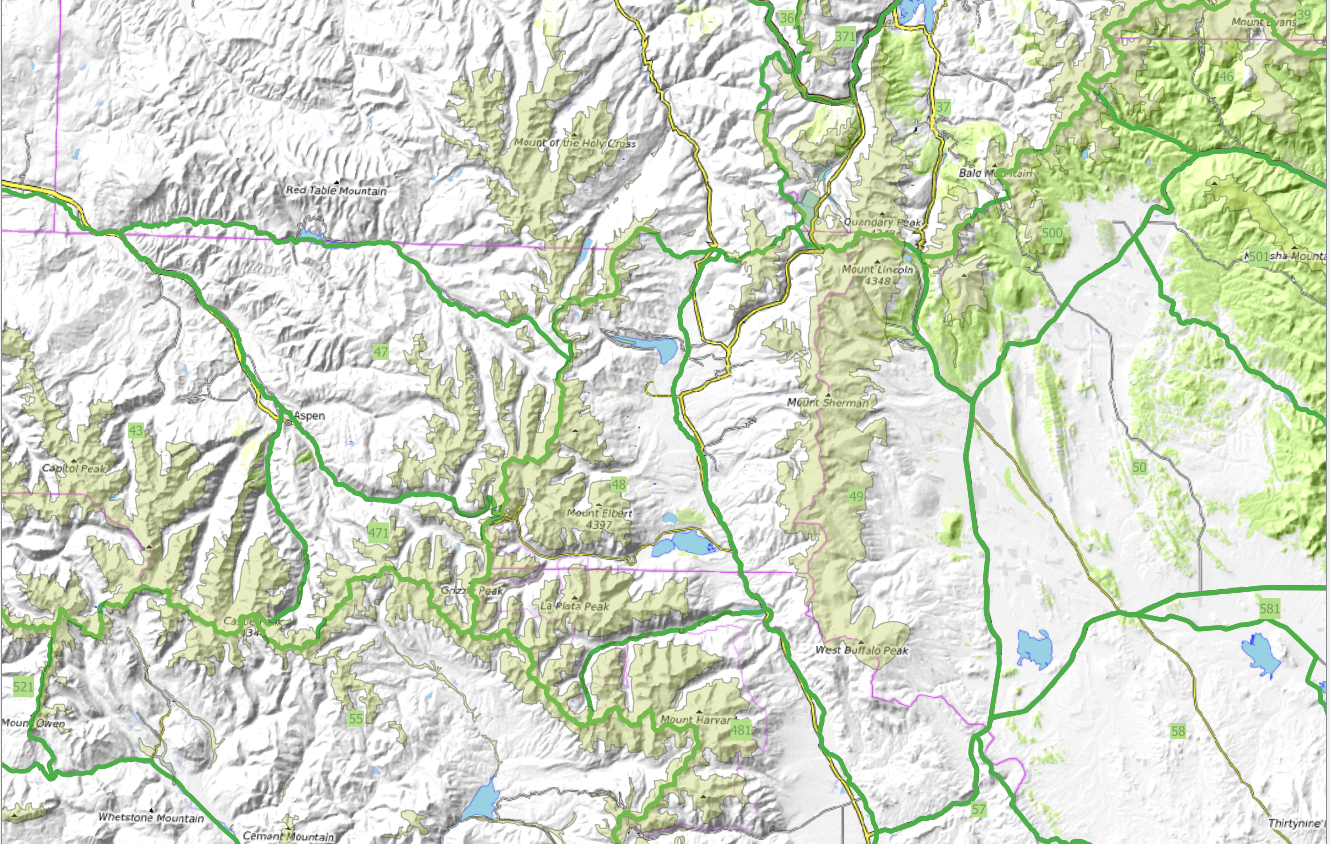
Now let’s take the Zoom button for a spin. You may have been zooming in and out this whole time, but you can click the Zoom In button and draw a box that zooms specifically to your selection. Let’s find some of that layer that was just added in the mountains and zoom to that.

The yellow is nice, but what peaks are covered up by that yellow, what trails do you take? What trail head parking lots are we looking at? Take the PtarmiganOverallRange layer and right click it, select Properties and go to the Symbology Tab. Let’s set the Layer Opacity to 35% or so on the slider and see what we’ve got. Click Apply and the map will preview what the opacity looks like. Fiddle with the opacity until you get something you’re happy with, then click OK.
Now we have the beginnings of some custom mapping for your own hunts. It takes a little getting used to, but in following this tutorial you inadvertently learned all of the effort that goes behind people like Hunterra and OnX Maps products. This is not easy stuff, but in the end you’ll be able to customize these maps in ways that just aren’t possible with the commercial software.
That said, how do these maps compare to the ones that CPW makes available to you in the regulations books? After all, I’ve been complaining this entire time. What’s the standard? Well, after looking I stand corrected, it wasn’t in the regulations at all but a map was available on their website. The map looked like this.
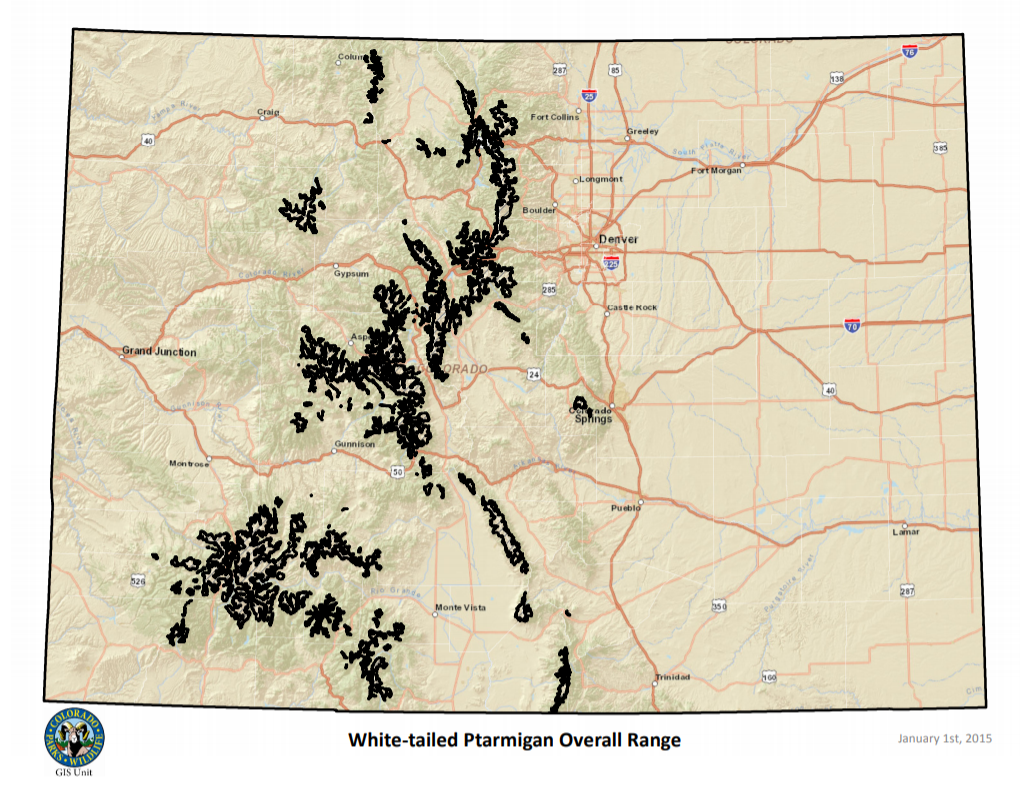
When you control the map, you control how you want your information displayed. Perhaps the Google Hybrid Map is great but you’ve done your cyber scouting and now you want something that you can print and take with you. Change the XYZ Tile Server we used above to the OpenTopo map and get something like the below. Same information, same geography, better on the printer.
https://tile.opentopomap.org/{z}/{x}/{y}.png
Does this seem to daunting? If so, check out our resource listing for online mapping services provided by the State fish and game agencies. Maybe your state has just what you needed. Using these skills you can make your own custom maps, and even have them printed!


Dude, this is amazing, thank you for the write up, I’m gonna make my own maps! Nice work!